Simulated performance. All results shown on this page were generated in an Interactive Brokers paper-trading (demo) account using simulated capital. No real money was at risk, no client funds are or have been managed, and results reflect a research and validation program — not a live managed product or an offer of any advisory service. Simulated trading results have inherent limitations and do not reflect actual trading conditions, including real order fills, liquidity, and market impact. Past performance — simulated or actual — does not guarantee future results.
Vhalanx Core is a subscription software product and is broker-agnostic. Subscribers connect and control their own brokerage accounts; the software does not custody assets, manage money, or provide personalized investment advice.
Forward testing
Interactive Brokers paper account · Current long/short strategy
| Month | TWR | Sharpe | Max Drawdown |
|---|---|---|---|
August 2026Latest | +2.95% | 1.83 | 3.06% |
July 2026 | +11.00% | 5.28 | 2.19% |
June 2026 | +10.42% | 3.39 | 3.63% |
Current strategy: long/short, leveraged. Gross exposure varied by month.
TWR is Time-Weighted Return from IBKR PortfolioAnalyst, net of fees & commissions. Sources detailed in Methodology & Sources.
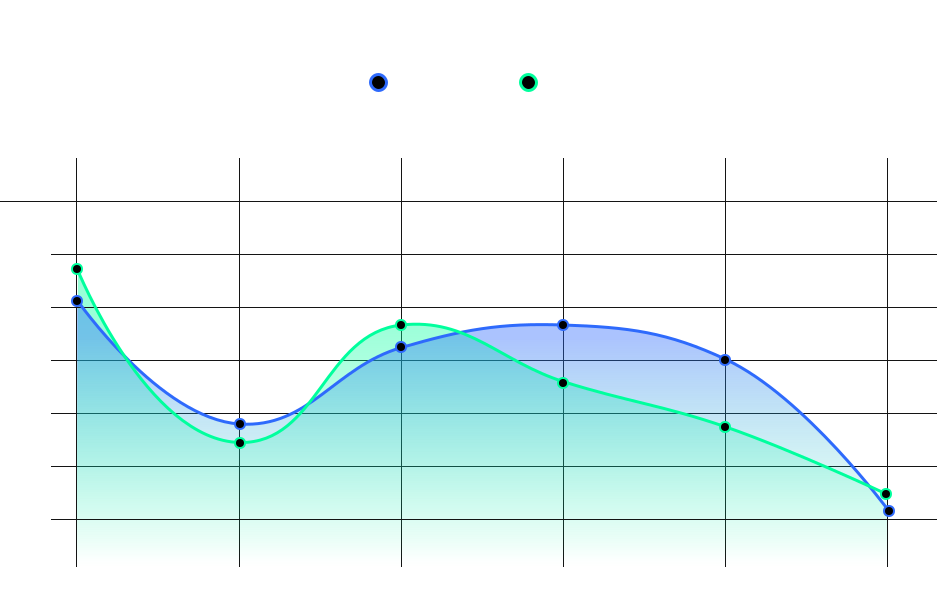
June → July → August Time-Weighted Return from IBKR PortfolioAnalyst. Only Vhalanx Core TWR is plotted below.
Benchmark identity on the IBKR statements (not plotted as numeric series here): S&P 500 Total Return (SPXTR), EFA, and VT.
| Month | Vhalanx Core (TWR) |
|---|---|
| June 2026 | +10.42% |
| July 2026 | +11.00% |
| August 2026 | +2.95% |
Plotted series: Vhalanx Core TWR only. Benchmark comparisons are derived from Interactive Brokers PortfolioAnalyst reports using SPXTR, EFA, and VT. On each monthly statement, PortfolioAnalyst plots account cumulative return alongside SPXTR, EFA, and VT. S&P 500 Total Return (SPXTR) is not characterized as a price-return index. Period-end benchmark return percentages are not independently reconstructed from third-party websites. IBKR PortfolioAnalyst comparison series for June, July, and August 2026: SPXTR, EFA, and VT. Machine-readable period-end returns for those series were not available in the supplied statements; third-party website reconstructions have been removed. Each month is a separate window — figures are not chained into a multi-month cumulative return.
In both June and July the month's return was carried disproportionately by a small number of positions rather than being broadly distributed — in July the two largest contributors accounted for roughly two-thirds of the month's return. This is the exact concentration the risk governor is designed to flag, and it has not yet done so. Per-name exposure caps are the next addition.
Sharpe ratio and maximum drawdown are calculated by IBKR over individual monthly periods. With roughly 21 observations, Sharpe is highly sensitive to sample size and should not be annualised. Maximum drawdown is within-month rather than across the full forward-test record.
February reflects an earlier long-only, unleveraged configuration and is shown separately from the current strategy.
February 2026 · February 2–16
| Return | +5.81% |
| Sharpe | 2.76 |
| Sortino | 6.08 |
| Max Drawdown | 2.67% |
| Win Rate | 62.5% (10 of 16 trading days) |
| Mean Daily Return | 0.21% |
| Standard Deviation | 1.13% |
| Configuration | Long-only, unleveraged, positions closed flat daily |
Source: IBKR Activity Statement, February 2–16, 2026
Results are from an Interactive Brokers paper-trading account and are simulated/hypothetical, not live-capital or client performance. Vhalanx returns are reported using PortfolioAnalyst Time-Weighted Return (TWR). Strategy configuration, leverage, and capital base varied across periods.
Benchmark comparisons are derived from Interactive Brokers PortfolioAnalyst reports using SPXTR, EFA, and VT. On each monthly statement, PortfolioAnalyst plots account cumulative return alongside SPXTR, EFA, and VT. S&P 500 Total Return (SPXTR) is not characterized as a price-return index. Period-end benchmark return percentages are not independently reconstructed from third-party websites.
IBKR PortfolioAnalyst comparison series for June, July, and August 2026: SPXTR, EFA, and VT. Machine-readable period-end returns for those series were not available in the supplied statements; third-party website reconstructions have been removed.
Research environment
Backtest · Not paper-traded · Not live capital
This section contains modeled historical results, not traded or paper-traded results.
This is a backtest. The figures below are produced by a historical simulation of the strategy over past market data. They are modeled, not traded — hypothetical results with no real or paper orders, and they are distinct from the paper-traded results shown above. The cost basis (fees, slippage, commissions) and whether strategy parameters were fixed in advance or fitted to the tested period have not been independently established, and these results should be read as directional/illustrative only. Hypothetical and backtested results have well-known limitations, including the benefit of hindsight, and frequently differ materially from results achieved in real trading.
Historical Simulation (Backtest) — Research Environment
Core metrics comparison table:
| Metric | Governor Portfolio | SPY BUY-and-Hold |
|---|---|---|
| Total Return | +81.21% | +97.55% |
| Annualized Return | +15.27% | +18.35% |
| Sharpe Ratio | 0.55 | -- |
| Max Drawdown | 20.93% | 26.33% |
| Alpha (annualized) | +1.23% | -- |
| Cost basis | Not independently verified | |
| Parameter fitting | In-sample vs. out-of-sample not established |
Yearly breakdown table:
| Metric | Governor | SPY | Alpha | Sharpe | Max DD |
|---|---|---|---|---|---|
| 2021 | +21.22% | +24.18% | +2.96% | 1.58 | 5.26% |
| 2022 | -9.27 | -8.76% | +0.50% | -0.76 | 19.06% |
| 2023 | +16.66% | +17.57% | +5.25% | 1.14 | 4.69% |
| 2024 | +18.56% | +13.32% | +5.72% | 1.37 | 9.26% |
| 2025 | +15.68% | +9.96% | +0.07% | 0.75 | 14.63% |
| 2026 | +0.81% | +0.88% | +0.07% | 0.05 | 3.43% |
All rows above are backtested/modeled results, including 2026. These are distinct from the paper-traded February, June, July, and August 2026 results shown earlier on this page.
Backtest / Historical Simulation
Research-environment backtest only — separate from the June–August IBKR forward-test evidence above.
This image is the historical-simulation (backtest) equity chart delivered by the CMS. It is not Interactive Brokers PortfolioAnalyst forward-test cumulative return, and it is not a reconstruction of June–August SPXTR / EFA / VT series.
The Governor framework prioritizes drawdown containment and volatility targeting over raw return maximization. The AI Governor's primary objective is drawdown protection, cutting exposure during adverse conditions before losses compound. In the 2022 bear market, the Governor limited drawdown to 20.9% versus SPY’s 26.3%. In 2023 and 2024, the Governor generated +5.25% and +5.72% annual alpha respectively, demonstrating that risk management and returns are not mutually exclusive.
The information on this page is for informational purposes only and is not investment advice, an offer, or a solicitation to buy or sell any security or to engage any advisory service. Vhalanx Core is a research and technology platform; the results shown are from simulated (paper-traded) or hypothetical (backtested) operation and do not represent management of client assets. Past performance, whether simulated or actual, does not guarantee future results. Backtest results are hypothetical and do not represent actual trading. Paper trading results may differ materially from live trading conditions. Trading involves risk of loss.